Table of Contents
Kubernetes, also known as K8S, is an open-source system for programming deployment, scaling, and operating containerized applications. Kubernetes helps you deploy containers across a pool of computing resources, such as servers. The core feature of Kubernetes is that it makes it easy to deploy and manage containers. Through Kubernetes, you can quickly deploy your container and get it up and running on one of the servers. Kubernetes does much more than help you deploy a container to a server since it allows you to easily manage multiple application replicas within your pool of servers. It makes it easy to manage containers running across a pool of servers or other computing resources.
Monitoring Kubernetes Cluster Using Prometheus and Grafana
Also Read: How to Disable or Suspend CronJobs in Kubernetes
Kubernetes handles networking by providing a networking framework that helps you manage and control network communication between containers. It also provides various security features to build more secure applications within your Kubernetes infrastructure. It also offers configuration management features that help you manage application configuration and pass configuration data to your containers.
The Kubernetes Cluster
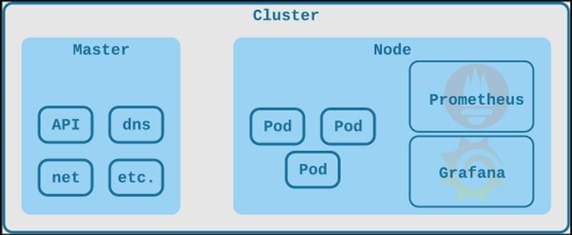
A Kubernetes cluster is simply a collection of worker machines that run containers. You have multiple machines running your containers; that collection of machines is your Kubernetes cluster.
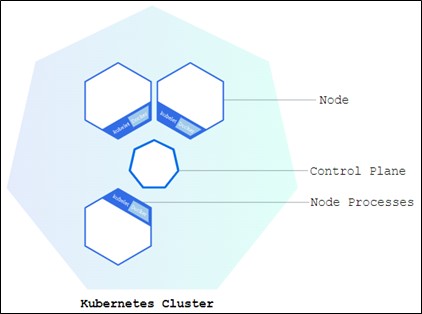
You have a control plane that manages one or more worker nodes. The Kubernetes control plane is a collection of services, essentially just applications that could run anywhere. Usually, they are all running on a server, and sometimes you refer to that server as the control plane server, which is just a collection of multiple different pieces of software. These services control the cluster, while the users interact with the Kubernetes cluster using the control plane that also monitors the state of the cluster. Thus, the control plane controls the cluster, while your worker nodes are responsible for running the containers.
A worker node runs containers within the cluster. Each node is only responsible for running and managing the containers on that particular node. The worker node also monitors the state of the containers running on that node and reports that state of information back to the control plane. Essentially, each node handles all containers running on that specific node.
NOTE:
The control plane, consisting of multiple individual components, manages the cluster as a whole by communicating back and forth with each worker node. If you want to, you can have various control plane servers so that if one of them goes down, your Kubernetes cluster is still available. Each Kubernetes worker node has multiple components as well. Worker nodes each have a container runtime to manage containers.
Building a Kubernetes Cluster
There are several ways to form a Kubernetes cluster, one of them is using a tool called kubeadm. kubeadm is the tool for “first-paths” when forming your first Kubernetes cluster.
You can access your account in a total of nine units, so building three medium servers will be sufficient to reach that limit. The majority of practice clusters may be created with a three-node cluster, allowing you to create any number of resources you desire.
Log in and Start Building
Once the servers show a “ready " status, go ahead and get logged in. Select the server to expand and view the details of each server. Click on the page icon next to the temporary password and click on the terminal to open it in a new browser tab. Type the username and paste it into the temporary password box.
The kubelet is the node agent that will run all the pods for you, including the kube-system pods. The kubeadm is a tool for installing multi-node Kubernetes clusters, while the kubectl is the command-line tool for communicating with Kubernetes.
Introduction to Monitoring
Monitoring Production For every Cluster Administrator, managing a Kubernetes cluster is a crucial and forward-thinking task. Prometheus and Grafana are two of the many options that can be used as part of the Kubernetes monitoring stack.
Prometheus is a complete solution that gives Developers and Sysadmins access to Kubernetes' extensive metrics features. The metrics are automatically collected every 30 seconds as per the default settings. Resources like Memory, CPU, Disk Performance, Network IO, and R/W rates are among the data gathered. Your cluster's metrics are default visible for up to 14 days, but the parameters can be changed to fit your situation.
Analytics and interactive visualization of metrics that are gathered and saved in the Prometheus database are done using Grafana. With Prometheus as the data source, you can design unique charts, graphs, and alerts for Kubernetes clusters.
Monitoring Using Prometheus and Grafana
a) Prometheus
Prometheus is an open-source monitoring tool used mostly for metrics tracking, event tracking, alert setting, etc. Targets, servers, databases, standalone virtual machines, etc., are all things that Prometheus is made to monitor. PromQL is a potent query language that Prometheus uses.
Prometheus components and configuration file:-
- Prometheus.yml : It is the Prometheus configuration file, prometheus.yml, where we can make all modifications to Prometheus' configuration.
- Promtool : Prometheus' configuration can be checked using the command-line utility tool known as Promtool.
- PromQL : Prometheus uses this powerful query language.
b) Grafana
You may query, view, alert on, and analyze your metrics, logs, and traces using Grafana open-source software, regardless of where they are kept. You can use the tools provided by Grafana OSS to create meaningful graphs and visualizations from the data in your time-series database (TSDB).
Hands-on: Monitoring using Prometheus and Grafana in Kubernetes
The complete CI/CD picture must include monitoring. To deploy regularly, you must be confident that if something is broken during a deployment, you will be able to find the issue and take immediate action to reduce the impact on customers. You will learn how to build up some fundamental Grafana dashboards in this activity to gain insight into the performance of the cluster and the applications running in it and how to install and set up Prometheus and Grafana in a Kubernetes cluster.
Lab Setup
We are going to build the train schedule app. Currently we have it running on a Kubernetes cluster, but we need to monitor to gain the visibility into the performance of the cluster and the applications running on it. We need to install and set up Prometheus to aggregate data and Grafana to display it on the dashboard. Both can be installed on the Kubernetes cluster itself. To make sure everything is working, we will need to create two dashboards in Grafana:-
- First we need to import the Kubernetes All Nodes community dashboard to display basic metrics about the Kubernetes cluster.
- Second, we need to create a new Dashboard and add a graph showing requests per minute for the Train Schedule App.
Prerequisites
Your environment should consist of two node.
- Kubernetes master
- Kubernetes worker node
Diagram
Step 1: Login to Master
Log in to your Kubernetes master node.
login as: cloud_user
cloud_user@52.3.235.75's password:
Welcome to Ubuntu 20.04.5 LTS (GNU/Linux 5.15.0-48-generic x86_64)

* Documentation: https://help.ubuntu.com
* Management: https://landscape.canonical.com
* Support: https://ubuntu.com/advantage

1 update can be applied immediately.
To see these additional updates run: apt list --upgradable

Your Hardware Enablement Stack (HWE) is supported until April 2025.
Last login: Thu Sep 27 17:12:24 2018 from 108.220.101.163
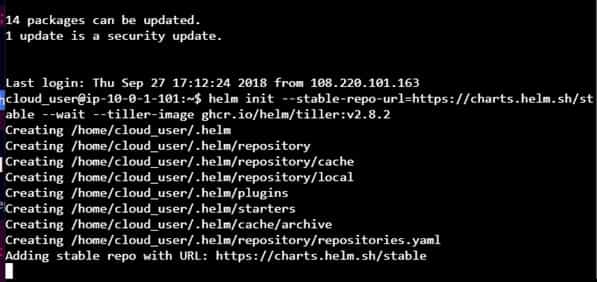
Step 2: Initialize Helm
Run the following command in your master node to initialize helm.
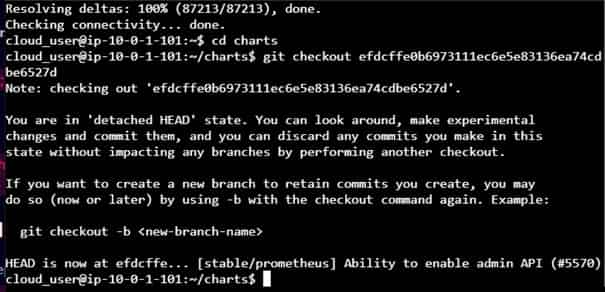
Step 3: Clone Kubernetes Charts
Clone the Kubernetes charts repo using git clone https://github.com/kubernetes/charts command and perform below steps to install Prometheus in the Kubernetes Cluster.
Step 4: Install Prometheus
Create a manifest file called prometheus-values.yml using vi editor and add below details in it.
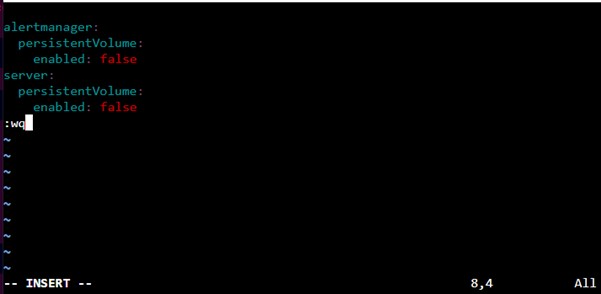
Save and close the file using :wq
Then use below helm command to install prometheus using above manifest file.
helm install -f ~/prometheus-values.yml ~/charts/stable/prometheus --name prometheus --namespace prometheus
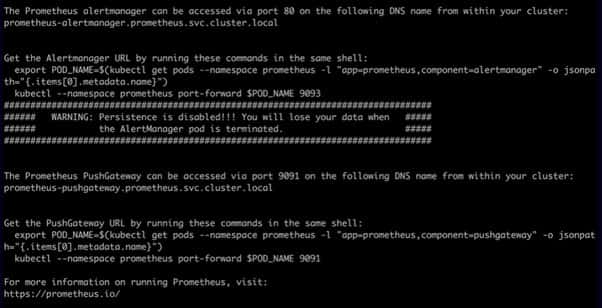
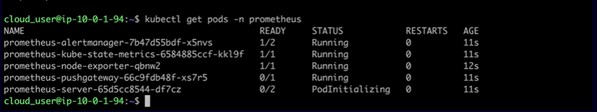
Step 5: Verify Prometheus Installation
You can verify the prometheus installation by checking the running status of pods using kubectl get pods -n prometheus command as shown below.
Step 6: Install Grafana
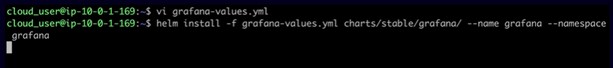
Create a manifest file called grafana-values.yml using vi editor and add the password that you will use to login into Grafana.
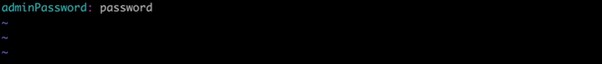
You can add password of your choice and then save and close the file using :wq
Then you need to use below helm command to install grafana using above manifest file.
helm install -f ~/grafana-values.yml ~/charts/stable/grafana --name grafana --namespace Grafana
Step 7: Verify Grafana Installation
You can verify the grafana installation by checking the running status of pods using kubectl get pods -n grafana command as shown below.

Step 8: Deploy NodePort Service
To provide external access to grafana, we need to deploy a NodePort service by creating below manifest file using vi editor:-
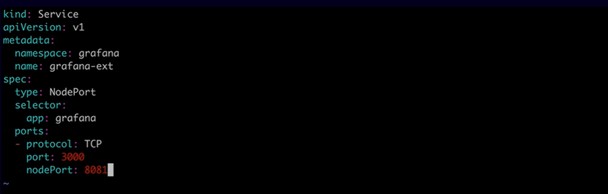
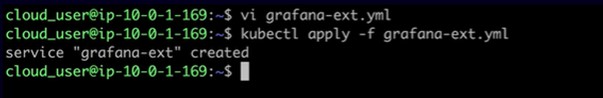
Save and close the file using :wq. Then deploy the service by using kubectl apply -f ~/grafana-ext.yml command as shown below.
Step 9: Login to Grafana
Now that Grafana is installed, it is time to login using node public ip address which in our case, it is 52.3.235.75 as shown in Step 1.

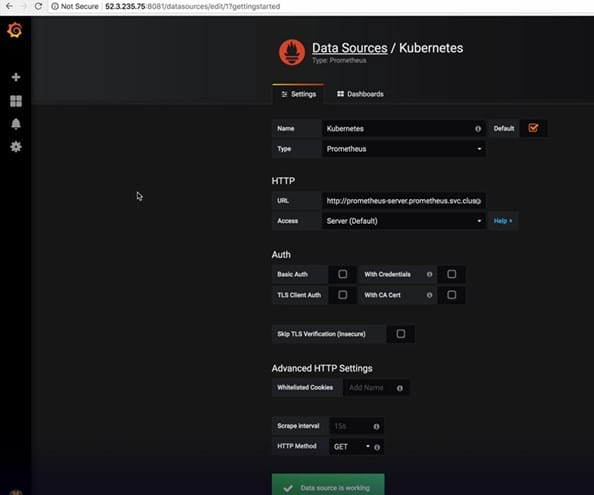
Step 10: Setup Data Source
After successful login, we need to first setup a Data Source. So to set up the data source, click on Add data source and provide below details:-
- Name: Kubernetes.
- Type: Prometheus
- URL: http://prometheus-server.prometheus.svc.cluster.local
Then Click on Save & Test.
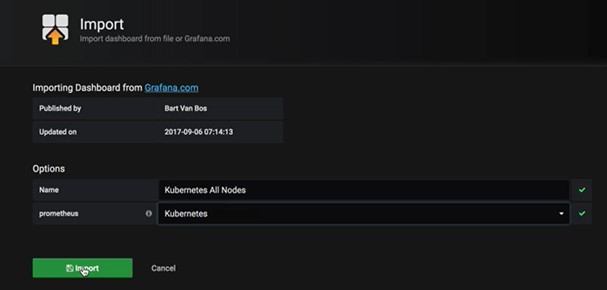
Step 11: Import Kubernetes All Nodes Dashboard
To import kubernetes all nodes dashboard, you need to hover your mouse over the (+) in the left sidebar and click on Import.
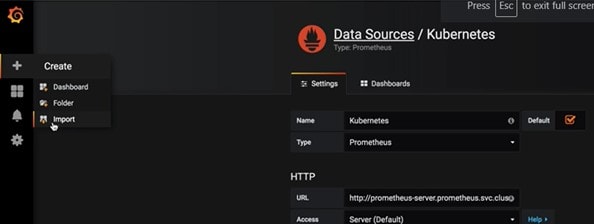
Then in the grafana.com dashboard field, provide ID as 3131. Click outside of the field to load information about the dashboard. Finally in the Options section, provide below details and click on Import.
- Name: Kubernetes All Nodes
- prometheus: Kubernetes
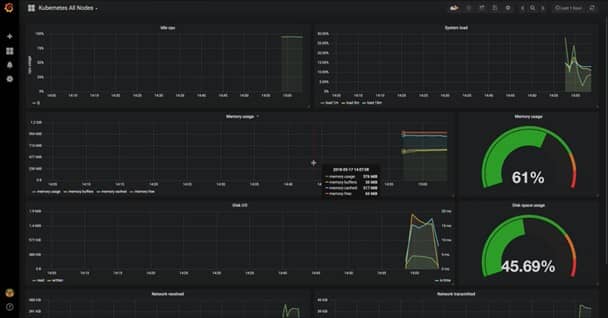
You will see Kubernetes All Nodes Dashboard imported as shown below.
Step 12: Creating Monitoring Dashboards
You can also choose to create your own monitoring dashboards. For that, you need to follow below simple steps:-
- Hover your mouse over the (+) in the left sidebar and click on Dashboard. Then select the Graph panel.
- In the General tab at the bottom of the screen, set the Title to Request Per Minute.
- In the Metrics tab, paste the following query:-
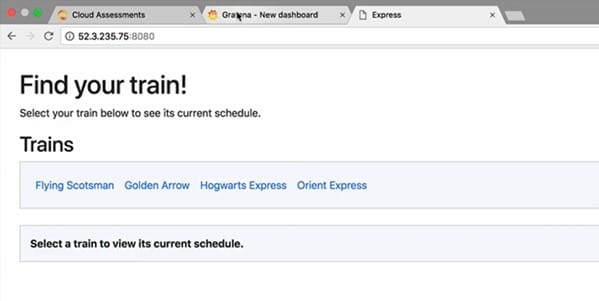
sum(rate(http_request_duration_ms_count[2m])) by (service, route, method, code) * 60 - With that in place, let's load the train-schedule app to give our graph some data:-<KUBERNETES_NODE_PUBLIC_IP>:8080
- Refresh the page a few times.
- Now, navigate back to the Grafana dashboard tab in your browser and click on the Save dashboard.
- Also in the top-right of the page, name the dashboard as "Train Schedule Performance" and click on Save.