
Table of Contents
Python can be used to plot multiple graphs. When we want to visualize data, we often need to plot multiple graphs. The library used for visualizing data in terms of graphs is Matplotlib. Performing a detailed analysis of the data helps you understand which features are important, what’s their correlation with each other which features would contribute in predicting the target variable. Different types of visualizations and plots can help you to achieve that. Here we will cover different examples related to the multiple plots using matplotlib.

How to Plot Multiple Graphs in Python Using Matplotlib
Also Read: How to use Scikit-Learn in Python [Complete Tutorial]
Prerequisites
To go through below tutorial, as a prerequisite it is expected that you have a running Windows or Linux System with Python installed in your System. To install python libraries, it is also expected that you have pip python package manager available in your System.
Installation
If you don’t have matplotlib available in your Windows system then you can install it by using this pip install matplotlib command as shown below.
C:\Users\cyberithub>pip install matplotlib
Collecting matplotlib
Downloading matplotlib-3.6.0-cp310-cp310-win_amd64.whl (7.2 MB)
---------------------------------------- 7.2/7.2 MB 8.7 MB/s eta 0:00:00
Collecting kiwisolver>=1.0.1
Downloading kiwisolver-1.4.4-cp310-cp310-win_amd64.whl (55 kB)
---------------------------------------- 55.3/55.3 kB ? eta 0:00:00
Collecting packaging>=20.0
Downloading packaging-21.3-py3-none-any.whl (40 kB)
---------------------------------------- 40.8/40.8 kB 1.9 MB/s eta 0:00:00
Collecting cycler>=0.10
Downloading cycler-0.11.0-py3-none-any.whl (6.4 kB)
Collecting numpy>=1.19
Downloading numpy-1.23.3-cp310-cp310-win_amd64.whl (14.6 MB)
---------------------------------------- 14.6/14.6 MB 6.8 MB/s eta 0:00:00
Collecting pyparsing>=2.2.1
Downloading pyparsing-3.0.9-py3-none-any.whl (98 kB)
---------------------------------------- 98.3/98.3 kB ? eta 0:00:00
Collecting contourpy>=1.0.1
Downloading contourpy-1.0.5-cp310-cp310-win_amd64.whl (164 kB)
---------------------------------------- 164.1/164.1 kB 10.3 MB/s eta 0:00:00
Collecting python-dateutil>=2.7
Downloading python_dateutil-2.8.2-py2.py3-none-any.whl (247 kB)
---------------------------------------- 247.7/247.7 kB 7.7 MB/s eta 0:00:00
Collecting fonttools>=4.22.0
Downloading fonttools-4.37.3-py3-none-any.whl (959 kB)
---------------------------------------- 960.0/960.0 kB 7.6 MB/s eta 0:00:00
Collecting pillow>=6.2.0
Downloading Pillow-9.2.0-cp310-cp310-win_amd64.whl (3.3 MB)
---------------------------------------- 3.3/3.3 MB 8.7 MB/s eta 0:00:00
Collecting six>=1.5
Downloading six-1.16.0-py2.py3-none-any.whl (11 kB)
Installing collected packages: six, pyparsing, pillow, numpy, kiwisolver, fonttools, cycler, python-dateutil, packaging, contourpy, matplotlib
Successfully installed contourpy-1.0.5 cycler-0.11.0 fonttools-4.37.3 kiwisolver-1.4.4 matplotlib-3.6.0 numpy-1.23.3 packaging-21.3 pillow-9.2.0 pyparsing-3.0.9 python-dateutil-2.8.2 six-1.16.0
If you are using Debian/Ubuntu based Linux system, then you can install matplotlib by using pip install matplotlib command as shown below. If you are having latest Python 3 then you can install matplotlib library by using sudo apt install python3-matplotlib command.
cyberithub@ubuntu:~$ pip install matplotlib
Collecting matplotlib
Downloading matplotlib-3.6.0-cp38-cp38-manylinux_2_12_x86_64.manylinux2010_x86_64.whl (9.4 MB)
|████████████████████████████████| 9.4 MB 1.5 MB/s
Collecting fonttools>=4.22.0
Downloading fonttools-4.37.3-py3-none-any.whl (959 kB)
|████████████████████████████████| 959 kB 7.6 MB/s
Requirement already satisfied: cycler>=0.10 in /usr/lib/python3/dist-packages (from matplotlib) (0.10.0)
Requirement already satisfied: python-dateutil>=2.7 in ./.local/lib/python3.8/site-packages (from matplotlib) (2.8.2)
Requirement already satisfied: packaging>=20.0 in /usr/lib/python3/dist-packages (from matplotlib) (20.3)
Requirement already satisfied: numpy>=1.19 in ./.local/lib/python3.8/site-packages (from matplotlib) (1.23.3)
Requirement already satisfied: kiwisolver>=1.0.1 in /usr/lib/python3/dist-packages (from matplotlib) (1.0.1)
Requirement already satisfied: pillow>=6.2.0 in /usr/lib/python3/dist-packages (from matplotlib) (7.0.0)
Requirement already satisfied: pyparsing>=2.2.1 in /usr/lib/python3/dist-packages (from matplotlib) (2.4.6)
Collecting contourpy>=1.0.1
Downloading contourpy-1.0.5-cp38-cp38-manylinux_2_17_x86_64.manylinux2014_x86_64.whl (295 kB)
|████████████████████████████████| 295 kB 6.6 MB/s
Requirement already satisfied: six>=1.5 in /usr/lib/python3/dist-packages (from python-dateutil>=2.7->matplotlib) (1.14.0)
Installing collected packages: fonttools, contourpy, matplotlib
Successfully installed contourpy-1.0.5 fonttools-4.37.3 matplotlib-3.6.0
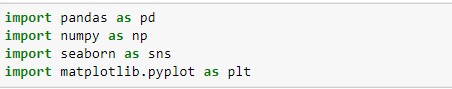
Importing
The plt alias is typically used to import the majority of the Matplotlib functions, which are located in the pyplot submodule. To use matplotlib, we will import this library in our Jupyter notebook file first. With this, we will import numpy and pandas libraries that are required.
Now the pyplot module can be referred as plt as shown above.
Pyplot
Let’s try to draw a very simple diagram with plt.

The output of this code is:-

As we can see in above fig, on the x-axis, the range of number are from 0 to 6 as we have defined range in code snapshot x = np.array(0,6). As well as on the y-axis, the range of number are from 0 to 6 as we have defined range in code snapshot y = np.array(0,250). In short, The x is the horizontal axis. The y is the vertical axis.
Subplots
We can draw more than one plot using plt.subplots(). Let’s try to build two plots in one figure.

In this example, ax1 is used for first plot and ax2 used for second plot. And we have assigned values to x and y in previous section pyplot. The output of the above code snippet is:-

In this snapshot, we can see on first figure, liner is originating from bottom to upwards, its showing positive values. In the Second figure, line originating from upper edge to bottom, its showing negative values.
Plotting Without Line
To plot only the markers, you can use shortcut string notation parameter 'o', which means 'rings'.
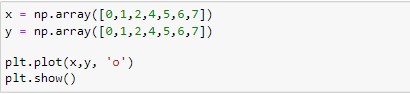
The output of the above code will be:-

We can draw two points in the diagram at our required positions. Let’s draw one at position (1, 8) and one in position (3, 10):-

We can clearly see two points in following figure. If we consider first point that is at the bottom corner at the position of 1 at x-axis and 3 at the y-axis according to the coordinates we have specified in the code and same goes for other point/coordinates.

Other than that, if we do not specify the points in the x-axis, they will get the default values 0, 1, 2, 3, etc. depending on the length of the y-points. So, if we take the same example as above, and leave out the x-points, the diagram will look like this:-

The output of this code is:-

We can clearly see in this figure it’s not bothering x-points at all.
Matplotlib Line style
We can plot line of multiple styles by using “linestyle” or ls keyword. Let’s plot dotted line first:-

The output of the above code will be:-

Let’s try dashdot line now:-
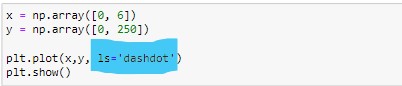
The output dashdot line will look like:-

Matplotlib Line Color
Another interesting feature is we can change the color of line as well. We can do this by using “color” keyword or simply “c”. Let’s have a look how we can do this:-

The output will be:-

Matplotlib Line Width
We can use the keyword “linewidth” or ”lw” to change the width of the line. The linewidth value is a floating number, in points. Let’s have a look how we can do this:-

The output will look like:-

Multiple Lines
We can plot as many lines as we want by simply adding more plt.plot() function. Let’s have a look how we can do this.

The output will look like:-

Matplotlib Labels and Title
We can label x-axis and y-axis by using xlabel() and ylabel() functions with Pyplot. Suppose we want to write “Average Exercise Time” on x-axis and “weight loss” at y-axis. Let’s have a look how we can do this:-

We can clearly see labels on x-axis and y-axis.

Other than x and y labeling, we can also put title for entire graph or chart by using title() function with pyplot. Let’s have a look how we can do this:-

The output will be:-

We can clearly see Title on top of graph.
Matplotlib Gridlines
we can add grid lines to the plot by using the grid() function with Pyplot. Suppose we want to add grid lines in above graph. Let’s see how we can do this:-

The output will be:-

Let’s suppose we want to have grid on y-axis only. We can do this by axis parameter in the grid() function to specify which grid lines to display.

The output will be:-

Conversely, if we want to have grid x-axis only. Then we will specify axis = ‘y’.
Matplotlib Scatter Plot
A Scatter (XY) Plot has points that show the relationship between two sets of data. we can draw a scatter plot by using scatter() function with Pyplot. Scatter() function used for plotting scatter plot takes two arrays of the same length, one for the values of the x-axis, and one for values on the y-axis. Let’s see how it works:-

The output will be:-

We can set our own color for each scatter plot with the color or the c argument. Suppose we want to see dots or results of one plot or graph in green color and the other are in pink color in same figure or graph. Let’s see how it works.

The output will be:-

One most interesting factor is we can even set a specific color for each dot by using an array of colors as value for the c argument. The number of colors in c array should be equal to number of elements in x and y array to color easy dot in graph. Let’s see how we can do this:-

The output with each dot colored will be:-

Matplotlib Bar Chart
A bar chart is used when you want to show a distribution of data points or perform a comparison of metric values across different subgroups of your data. Bar() function used for plotting bar plot takes two arrays of the same length, one for the values of the x-axis, and one for values on the y-axis. Let’s see how it works:-

The output will be:-

Let’s see another example of bar chart according to categorical data:-

The output for categorical data on x-axis is:-

We can also specify color of bar chart as we want by using color or c argument. Let’s see an example:-

The purple colored bar chart will be:-

Matplotlib Histogram Charts
Histogram is used to show the frequency distribution of a small number of data points for a single variable. Histograms frequently divide data into different "bins" or "range groups" and count how many points are in each bin.
We can use the hist() function to create histograms. This function will take an array of numbers to create a histogram, the array is sent into the function as an argument. Let’s see how it works:-

The output will be:-

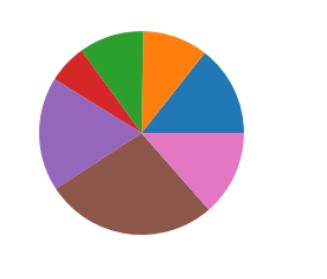
Matplotlib Pie Charts
We can use the pie() function to create pie charts. This function will take an array of numbers to create a pie chart, the array is sent into the function as an argument. Let’s see how it works:-

The output of pie chart will be:-
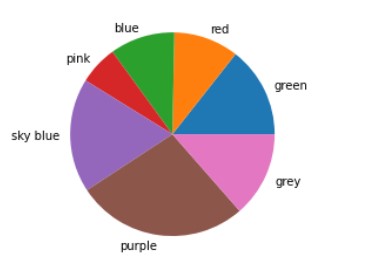
 We can also label our pie chart as per our requirements. Let’s see an example:-

The labelled pie chart will be:-
Conclusion
Matplotlib is powerful library of python that can be used for making or plotting multiple graphs or charts for data visualization or data analysis. Matplotlib is open source and we can use it freely. In this article, we have learnt that how we can plot multiple graphs by using matplotlib python. We have also covered how we can use python matplotlib for data visualization and graphical plotting.