Table of Contents
In this article, I will take you through the steps to Install Grafana PCP Plugin on CentOS 8/Fedora 35. According to Official Documentation, Performance Co-Pilot (PCP) provides a framework and services to support system-level performance monitoring and management. It presents a unifying abstraction for all of the performance data in a system, and many tools for interrogating, retrieving, and processing that data. This plugin not only supports the Grafana Alerting but also provide support for derived metrics. Here, we will see the steps to Install and then enable Grafana PCP Plugin in great detail.
Other Important Features
- It supports analysis of historical PCP metrics using pmseries query language.
- It supports enhanced Berkeley Packet Filter (eBPF) tracing using bpftrace scripts.
- It also supports analysis of real-time PCP metrics using pmwebapi live services.
- It allows full-text search in metric names, descriptions and instances.
- It fully supports automatic rate and time utilization conversion.
- It has excellent support for custom endpoint and hostspec per panel.
- It provides Sample Dashboards for all Data Sources.

How to Install Grafana PCP Plugin on CentOS 8/Fedora 35
Also Read: How to Change GRUB Menu Font Color in Ubuntu 20.04 LTS
Step 1: Prerequisites
a) You should have a running CentOS 8/Fedora 35 Server.
b) You should have dnf utility installed in your machine.
c) You should have sudo or root access to run privileged commands.
Step 2: Update Your Server
First logical step that you can think of doing before installing any new package is checking for any latest available updates by using dnf update command. This will search and install all the available stables updates from configured Repositories.
[root@localhost ~]# dnf update
Last metadata expiration check: 0:25:31 ago on Wed 24 Nov 2021 10:10:17 AM EST.
Dependencies resolved.
=============================================================================================================================================================
Package Architecture Version Repository Size
=============================================================================================================================================================
Installing:
centos-linux-release noarch 8.5-1.2111.el8 BaseOS 22 k
replacing centos-release.x86_64 8.1-1.1911.0.8.el8
replacing centos-repos.x86_64 8.1-1.1911.0.8.el8
kernel x86_64 4.18.0-348.2.1.el8_5 BaseOS 7.0 M
kernel-core x86_64 4.18.0-348.2.1.el8_5 BaseOS 38 M
kernel-modules x86_64 4.18.0-348.2.1.el8_5 BaseOS 30 M
Upgrading:
PackageKit x86_64 1.1.12-6.el8 AppStream 599 k
.............................................................
Step 3: Install Grafana PCP
In the next step, you can use dnf package manager to install Grafana PCP plugin in your System. To install, you can run dnf install grafana-pcp -y command as shown below. There are other ways to install the plugin in which this is the most recommended way.
[root@localhost ~]# dnf install grafana-pcp -y
Last metadata expiration check: 0:01:51 ago on Wed 24 Nov 2021 10:10:17 AM EST.
Dependencies resolved.
=============================================================================================================================================================
Package Architecture Version Repository Size
=============================================================================================================================================================
Installing:
grafana-pcp x86_64 3.1.0-1.el8 AppStream 9.4 M
Installing dependencies:
grafana x86_64 7.5.9-4.el8 AppStream 41 M

Transaction Summary
=============================================================================================================================================================
Install 2 Packages

Total download size: 50 M
Installed size: 208 M
Downloading Packages:
(1/2): grafana-pcp-3.1.0-1.el8.x86_64.rpm 6.6 MB/s | 9.4 MB 00:01
(2/2): grafana-7.5.9-4.el8.x86_64.rpm 10 MB/s | 41 MB 00:03
-------------------------------------------------------------------------------------------------------------------------------------------------------------
Total 10 MB/s | 50 MB 00:04
Running transaction check
Transaction check succeeded.
Running transaction test
Transaction test succeeded.
Running transaction
Preparing : 1/1
Installing : grafana-pcp-3.1.0-1.el8.x86_64 1/2
Running scriptlet: grafana-7.5.9-4.el8.x86_64 2/2
Installing : grafana-7.5.9-4.el8.x86_64 2/2
Running scriptlet: grafana-7.5.9-4.el8.x86_64 2/2
Running scriptlet: grafana-pcp-3.1.0-1.el8.x86_64 2/2
Running scriptlet: grafana-7.5.9-4.el8.x86_64 2/2
Verifying : grafana-7.5.9-4.el8.x86_64 1/2
Verifying : grafana-pcp-3.1.0-1.el8.x86_64 2/2

Installed:
grafana-pcp-3.1.0-1.el8.x86_64 grafana-7.5.9-4.el8.x86_64

Complete!
Step 4: Verify Installation
You can verify the installation by checking the list of installed Grafana Plugins. If you grep performancecopilot-pcp-app from the list of installed plugins then it should show something like below. This confirms plugin installed successfully.
[root@localhost ~]# grafana-cli plugins ls | grep performancecopilot-pcp-app
performancecopilot-pcp-app @ 3.1.0
Step 5: Restart Grafana Server
After successful installation, you can restart Grafana Server using systemctl restart grafana-server command and then check the service status by using systemctl status grafana-server command as shown below.
[root@localhost ~]# systemctl restart grafana-server
[root@localhost ~]# systemctl status grafana-server
● grafana-server.service - Grafana instance
Loaded: loaded (/usr/lib/systemd/system/grafana-server.service; disabled; vendor preset: disabled)
Active: active (running) since Wed 2021-11-24 10:15:19 EST; 6s ago
Docs: http://docs.grafana.org
Main PID: 4520 (grafana-server)
Tasks: 13 (limit: 11355)
Memory: 124.9M
CGroup: /system.slice/grafana-server.service
├─4520 /usr/sbin/grafana-server --config=/etc/grafana/grafana.ini --pidfile=/var/run/grafana/grafana-server.pid --packaging=rpm cfg:default.paths>
└─4534 /var/lib/grafana/plugins/performancecopilot-pcp-app/datasources/redis/pcp_redis_datasource_linux_amd64
Then enable the service by using systemctl enable grafana-server command as shown below.
[root@localhost ~]# systemctl enable grafana-server
Created symlink /etc/systemd/system/multi-user.target.wants/grafana-server.service → /usr/lib/systemd/system/grafana-server.service.
Step 6: Open Web GUI
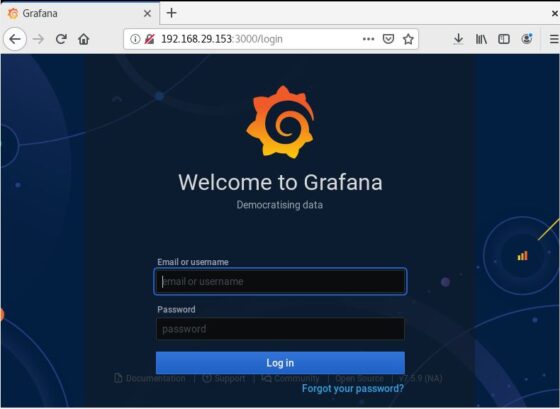
Go to your favorite Browser and use URL http://<local_server_ip>:3000 to open Grafana Login Page. Once the page is opened, you can use admin as both username and password. After providing the credentials, click on Login.
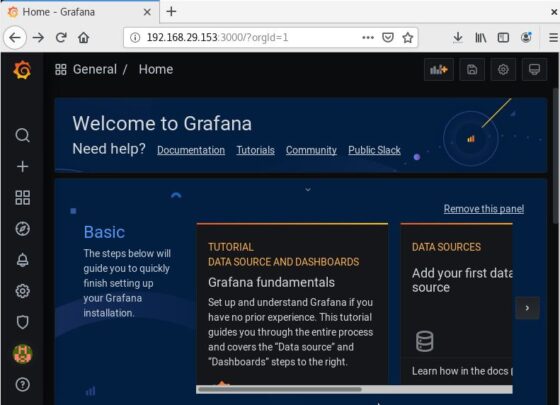
Once logged in, you will be asked to provide New Password. You can either provide the password or click on Skip to avoid changing it now. After successful login, you should see below Home Page.
You can now go to ![]()
![]() and click on Plugins. You should see a screen like below.
and click on Plugins. You should see a screen like below.
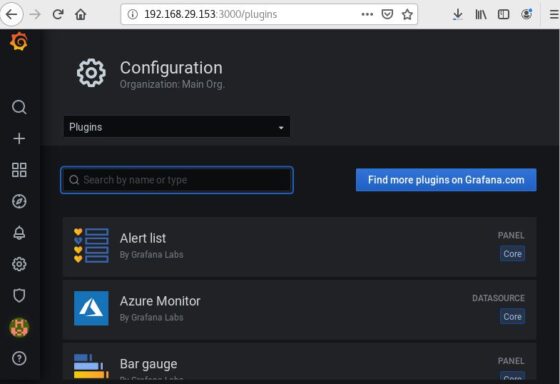
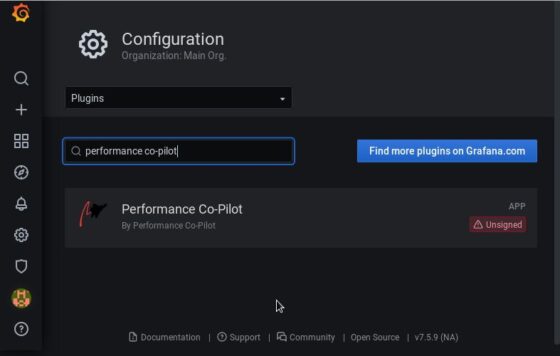
In the Search bar, you need to type performance co-pilot to search the plugin. Once it shows, you can click on it.
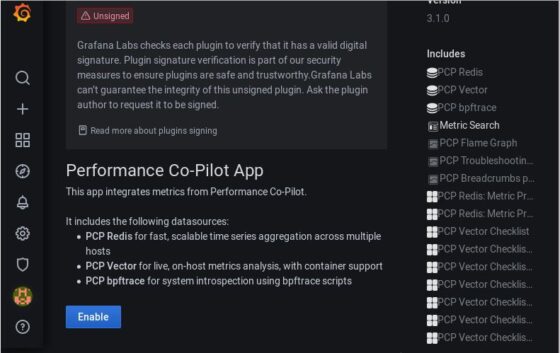
Once the plugin opened, you can scroll to the bottom where you can see Enable button like below. Click on it to enable the plugin.
Now again go to Configurations->Data Sources and Click on Add Data source to add a new Data Source.
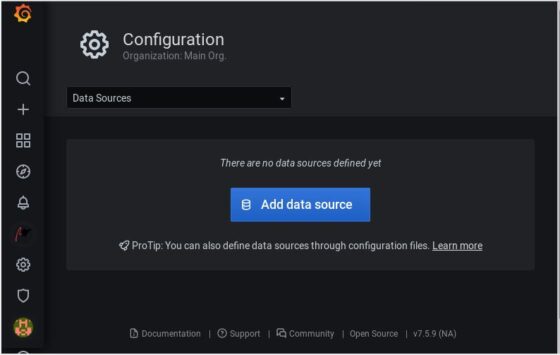
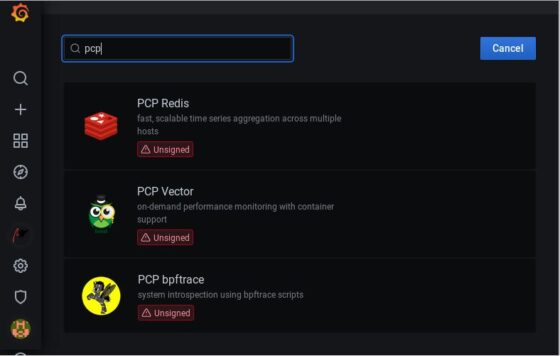
Here you can type pcp and then you will see below three data sources: PCP Redis, PCP Vector and PCP bpftrace. Click on it and add them one by one. That's it. You are done now.